recipes-and-ratings-analysis
View the Project on GitHub alyssrod/recipes-and-ratings-analysis
Introduction
This project analyzes the Recipes and Ratings dataset to explore how recipe characteristics (e.g., prep time, ingredient count) influence calories. I built a regression model that predicts calorie content based solely on features a user would see before cooking.
Name: Alyssa Rodriguez
Email: alyssrod@umich.edu
Data Cleaning and Exploratory Data Analysis
Histogram of Calories
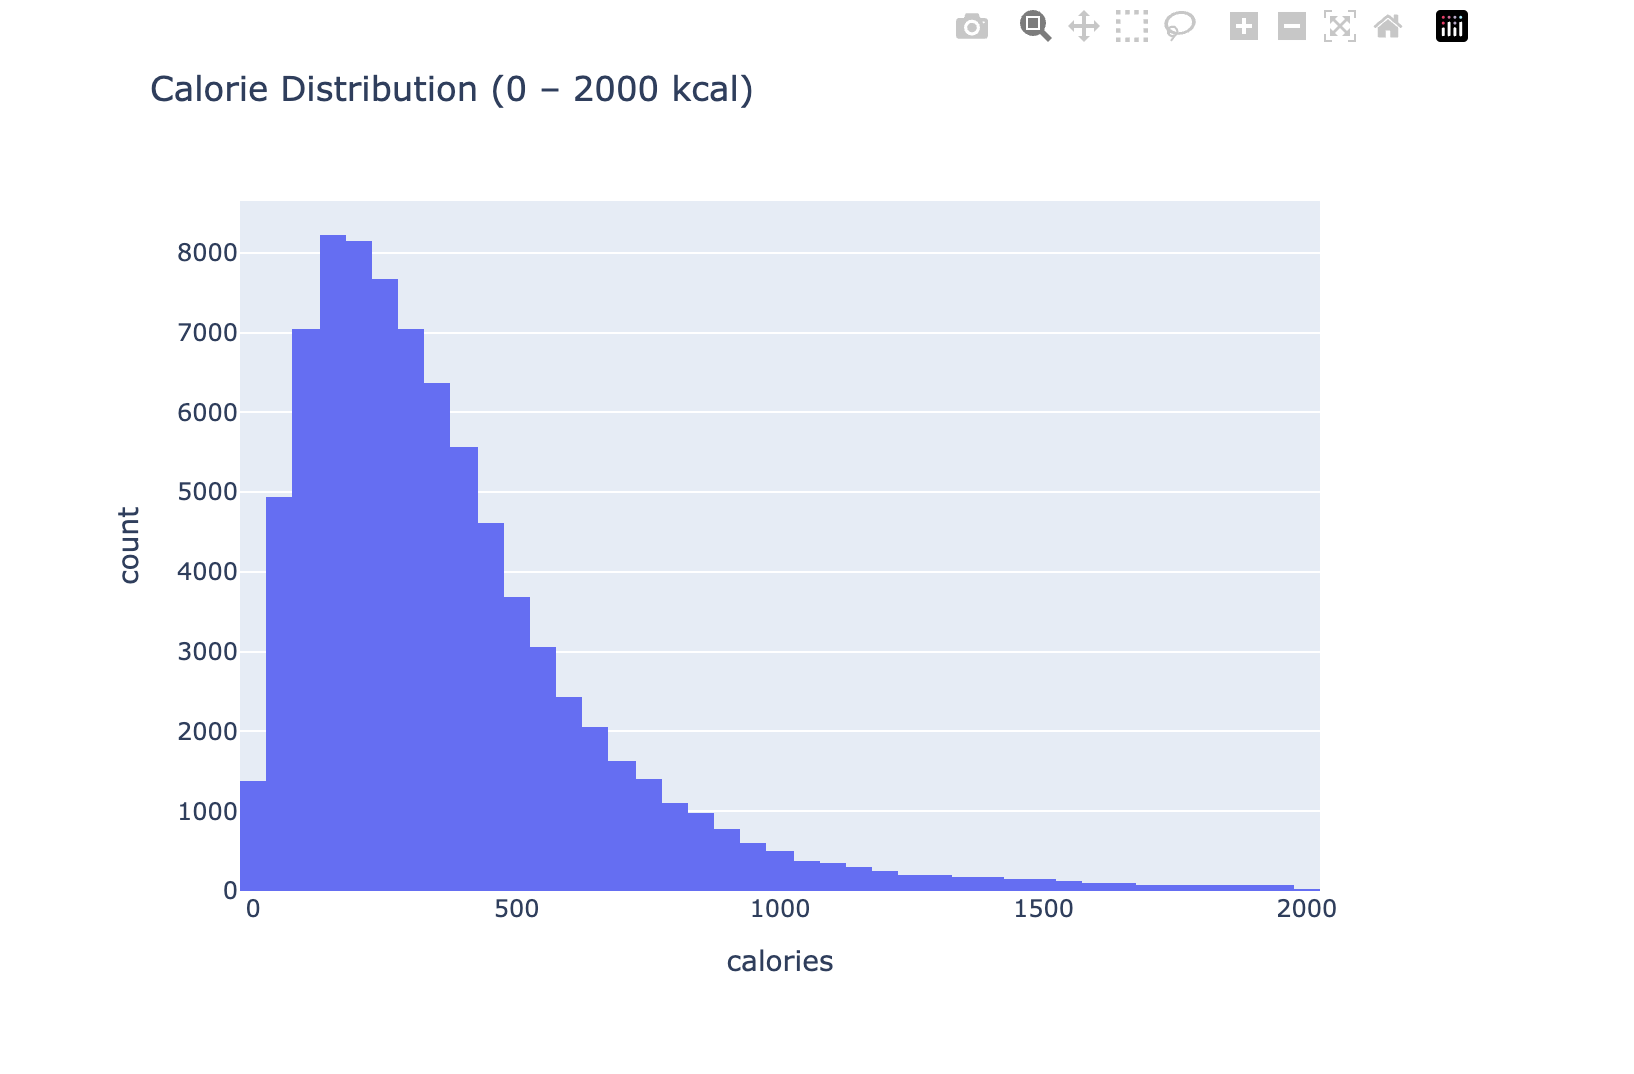
This histogram shows that most recipes fall between 100–800 kcal, though there are some high outliers, likely rich desserts or large dishes.
Calories vs. Prep Time
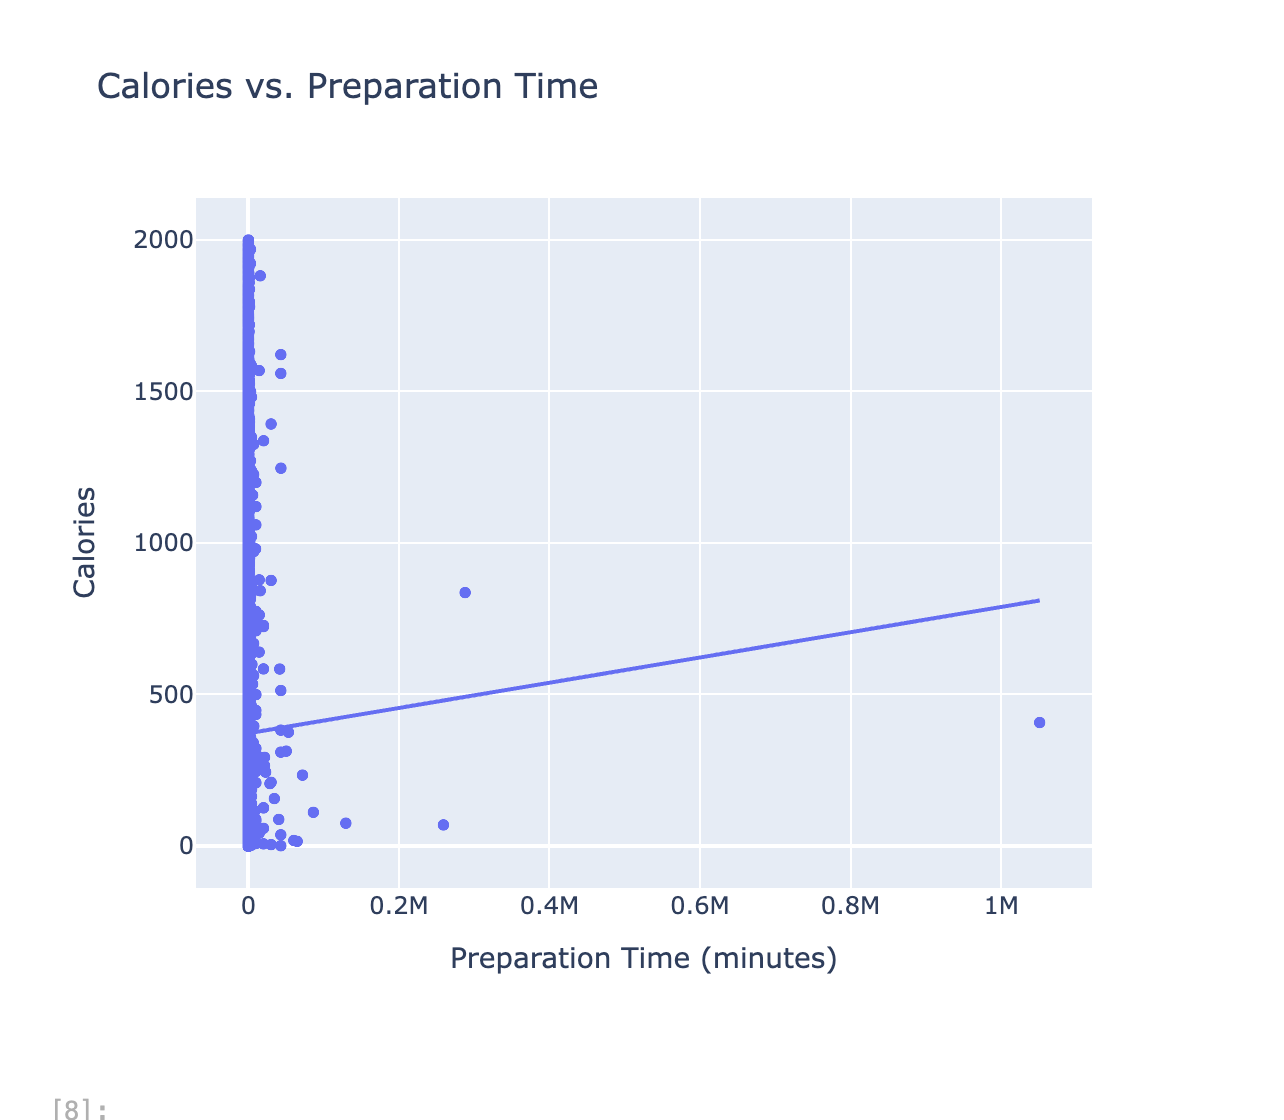
This scatterplot suggests a mild positive relationship: recipes with longer prep times tend to have slightly higher calories.
Ingredients vs. Mean Calories
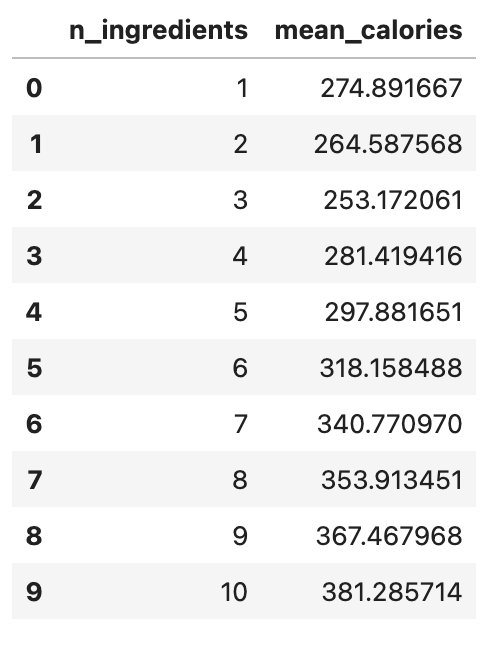
This table groups recipes by number of ingredients and shows their average calorie content. The trend confirms that more ingredients generally mean more calories.
Framing a Prediction Problem
I treated this as a regression problem: calories are a continuous value with meaningful differences (e.g., 300 vs 900 kcal).
Target Variable: calories
Metric: RMSE (Root Mean Squared Error)
I only used features known at “time of prediction” — prep time, ingredient count, tag length, etc.
Baseline Model
- Features Used:
minutes,n_steps,n_ingredients,tag_count,step_length_avg - Model: Linear Regression
- Baseline RMSE: 664 kcal
Final Model
- New Features:
minutes_per_step,ingredient_density - Model: Random Forest with hyperparameter tuning (
max_depth,n_estimators,min_samples_split) - Final RMSE: 512 kcal
Actual vs. Predicted Calories
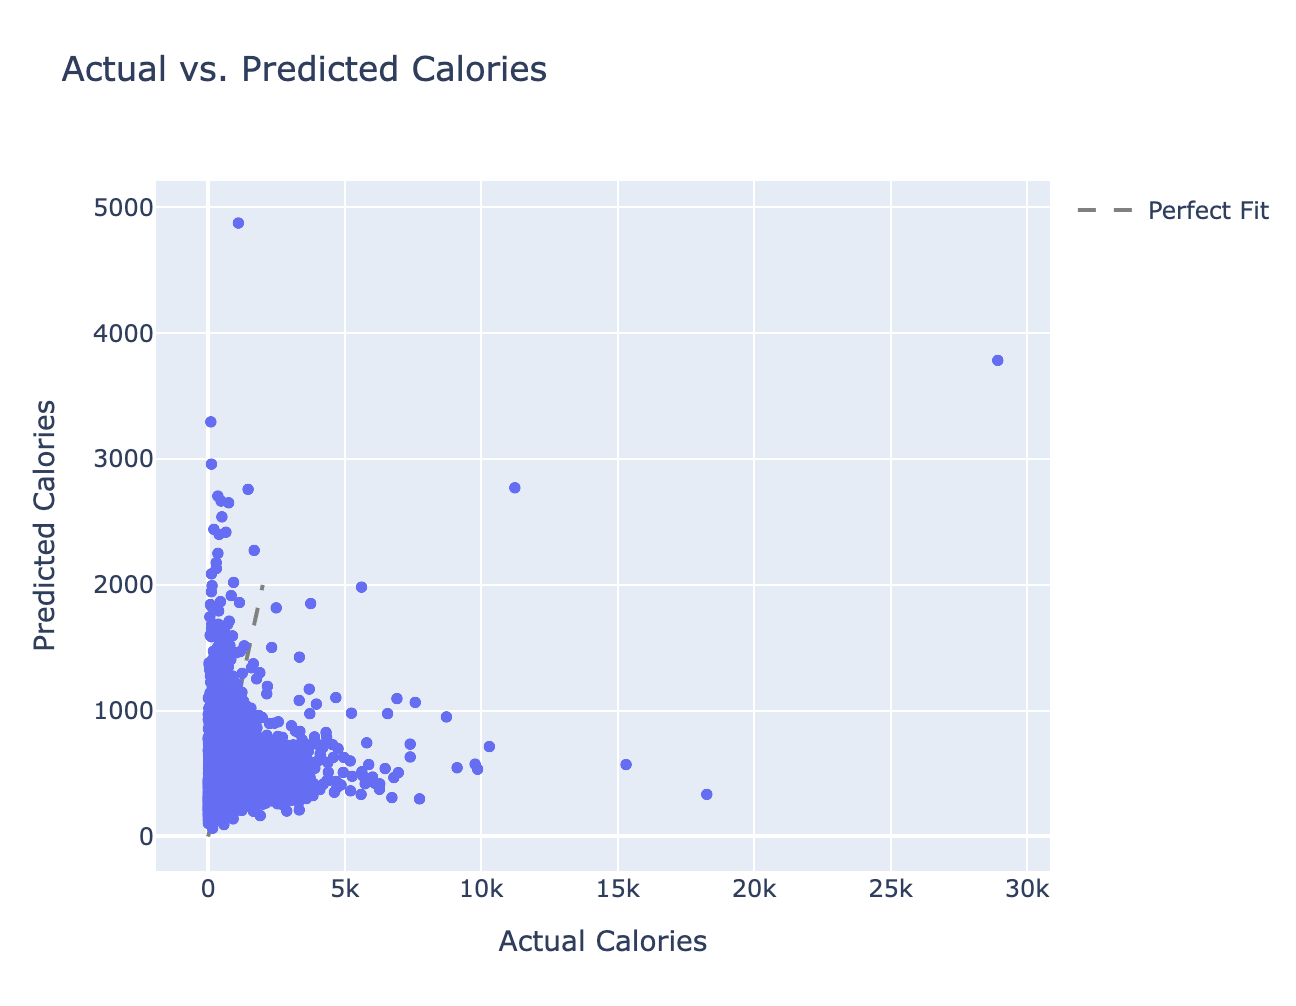
This scatterplot compares the final model’s predictions to the true calorie values. Points clustered near the diagonal line indicate accurate predictions.
Key Takeaways
- Recipes with more ingredients and longer instructions tend to be higher in calories.
- A simple linear model performs decently, but engineered features improve accuracy significantly (~23% better RMSE).
- This tool could help users estimate nutritional content without logging ingredients into calorie-tracking apps.